
What a Data Revamp Can Do: A Case Study
A hands-on example of the outsized benefits of a smarter architecture.

As some may know, I am doing two main things at the moment:
Independent Consulting on Data, AI, and scaling Software-as-a-Service companies
Building the premier Life Management Platform: Forward
So when given the opportunity to bring the two together, I can’t help but jump at the chance!
What we’ll cover today is a case of really dumb data mismanagement (by me) and a walkthrough fixing it (also done by me) such that it rapidly accelerated what Forward is able to do.
This is important because it is a good digestible version of a larger problem that plagues many companies: outdated architectures that are littered with dozens of ad hoc updates that turn it into a hulking mess that is both slow to use and slow to develop.
By going through this example, hopefully it shows you the art of the possible and the big benefits you can get from rethinking your data architecture (I can help!)
About Forward
We’ll keep this brief, but Forward is a web app that you can use to track habits, tasks, goals, projects, and reminders. The link is above if you’d like to try it!
As far as our data is concerned, we store it in a Postgres database with only about 10 tables.
This part is fine, and as the biggest power user, I am constantly stress testing the system, but after almost a year of use, my data is sitting at ~300 kilobytes of raw data. So, we’re not exactly pushing the envelope here on data processing.
But as you may know, building a modern web app requires a lot of manipulation of that data, storage of both the data and derivations within React’s state, and constant processing of that data.
The Existing Habit Calculation Setup
Of course, any good habit tracker needs to have some good ways for you to analyze that daily data!
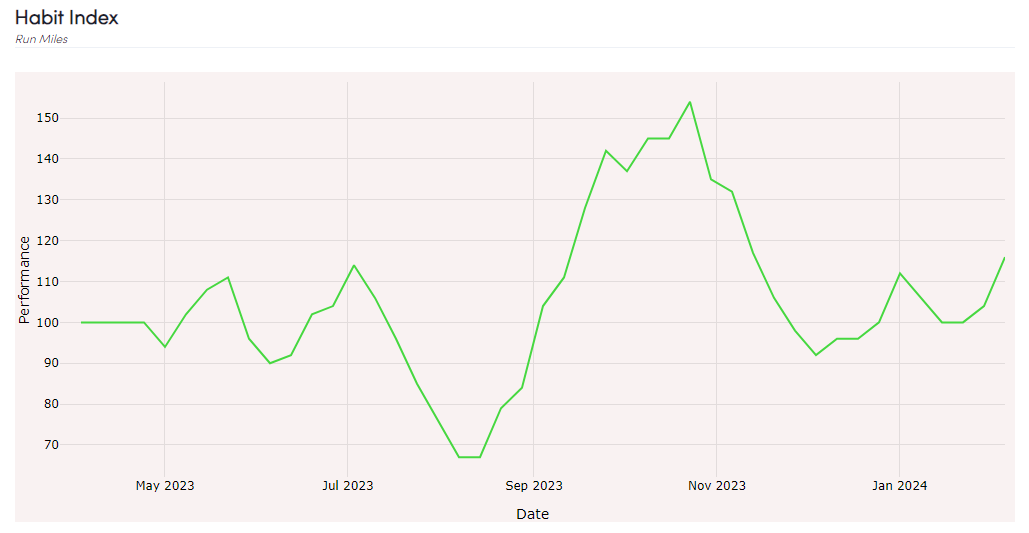
Habits in Forward can optionally have a target set, which is a weekly goal for you to hit. This target can be adjusted over time, and each week you’ll either hit your target or miss it.
So our existing analysis consisted largely in gathering the weekly data necessary to produce this chart:
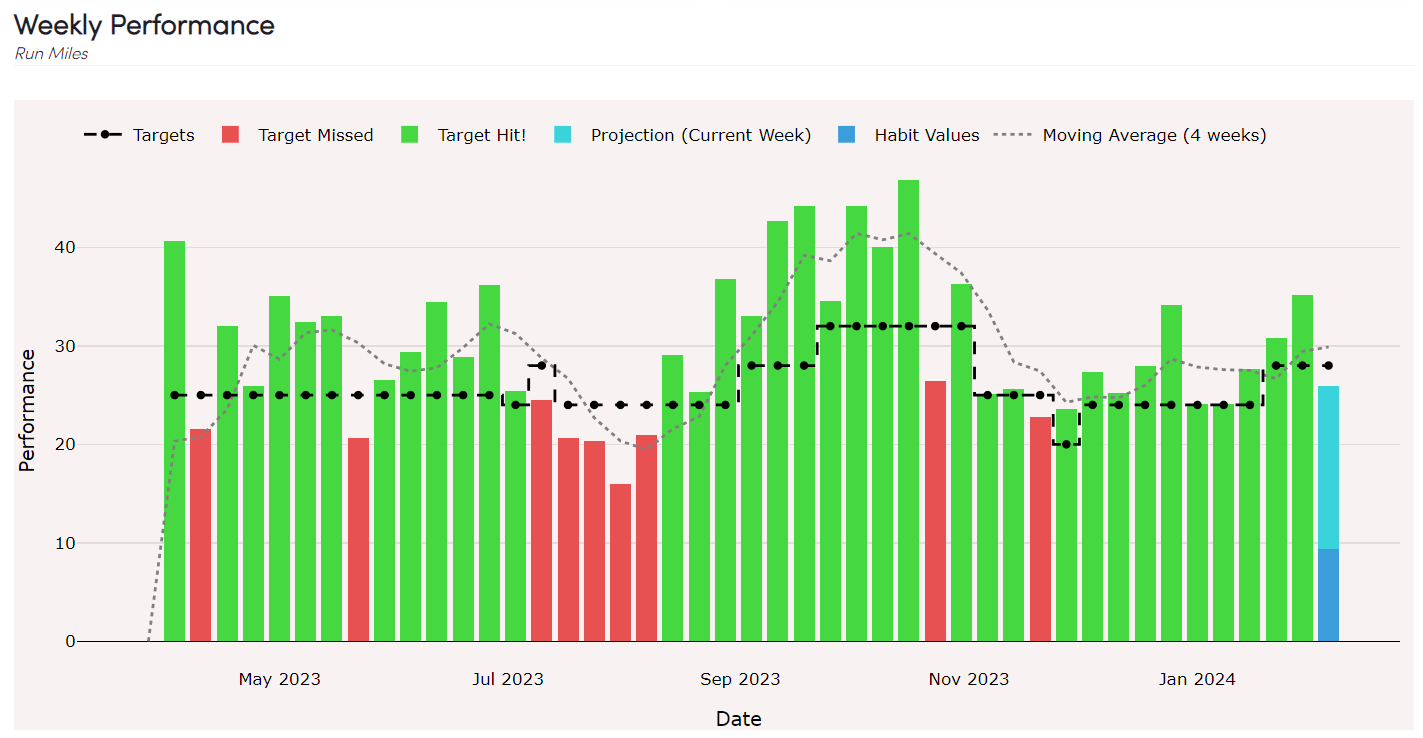
Along with that, we kept track of your streak of weeks hit or missed: so we’d be at 10 weeks currently, but had a -5 streak back in August (Texas Summers, what are you going to do?).
And lastly there was the minor “I need to show a progress bar of where I stand for the current week, which looks like this:

Now, as you can imagine, these numbers show up around the app in a few other places, so we had stored a habit element within our state that looks like this:
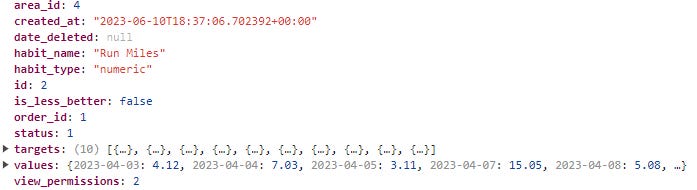
And I won’t bore you too much with the details, but you can see the raw data within values and each time the user changes their target, it’s added to the targets list.
Now, to translate all this into the chart and numbers you see above, there had to be a lot of calculations done. You have to find the latest target for a date, aggregate the values by week, process all that week-by-week so that you can determine the user’s streak, et cetera.
What we ended up with was perhaps what you might expect from organic growth: we had a utility file, habits.js that had ballooned to almost 500 lines of code across over a dozen functions to do various parts of this math.
To make matters (much) worse, many of those functions were then called in over a dozen different places: the habit page, the graph, the home page’s habit cells, and more.
This largely presented two problems:
It was a mess for me to try to build anything new into this tangled web. I didn’t know where to start, I wasn’t sure how many spots I’d need to change something, and you can only imagine how it would have looked for someone else!
The processing was slow: it was inefficient, calculations were being done in multiple places and based on my logging they were often running when they had no need to be.
Put simply: this part of the app had become an unworkable clusterfuck. It was proudly my own clusterfuck.
If you work with data in any capacity, I am sure you can draw parallels from my story to a clusterfuck you have to deal with. But if you are just a consumer of data or the insights from it, you may not know the mess that lies underneath. But some symptoms you may notice are:
The data, insights, or dashboards are slow to pull and generally unpleasant to use
The features set is limited and new features are rarely if ever added.
If you ask “hey, can we add this?” you’ll see a bunch of nervous glances before they somehow weasel away from the ask.
When the system breaks, you’ve got to call a guy named Joe. Joe’s been at the company for 20 years and he’ll fix it. If Joe’s out on vacation? Good luck.
But thankfully, untethered from bureaucratic risk aversion, I could just go and fix this system of my own making! Let’s talk about how it’s done.
Making the Decision
As I considered this problem, I strongly believed the resolution involved storing the statistical data within its own isolated part of our React state. This would:
Allow the data to be grabbed from almost anywhere in the app, and to do it quickly.
It would ensure consistency, as we’d be using the same data source
It should reduce the total amount of calculations that we’d need to do dramatically if we implemented it properly
But, it would come with some downsides, notably:
We’d likely increase our upfront calculations upon loading the site to calculate all of this right after the habit data is pulled.
We’d risk showing someone a consistent but out-of-date stat if our logic did not recalculate the necessary data whenever a user updated a habit.
And of course, a potential third: this whole revamp was going to be a lot of work, without any guarantee of success or payback. This is generally the point that keeps companies from reworking existing systems, and it is a very fair consideration. Without a known cost and a known benefit, it is hard to justify much of anything in today’s corporate culture.
Thankfully, it did work, and with about 20 hours of work, we’ve:
Made the change as described, dramatically improving performance
Added in a bunch of new features while still simplifying the code base
Laid the groundwork for some planned future work for project and task analytics to leverage the same infrastructure
The New Statistical Architecture
Before getting started, I did a bit of scratch work to map out what I was going for. The gist here is that the stats portion of our state contains an element for each habit that looks like this:
As soon as we pull the habit data within the main app, we calculate these elements. Because the calculation is all consolidated upfront, we only need to loop through the data once, tracking all the weekly stats as we do it and then calculating the current stats on top of that.
But, the big question quickly became: if we have these objects, how do we ensure that the data is updated only when it needs to be? Thankfully this time I documented the plan upfront:
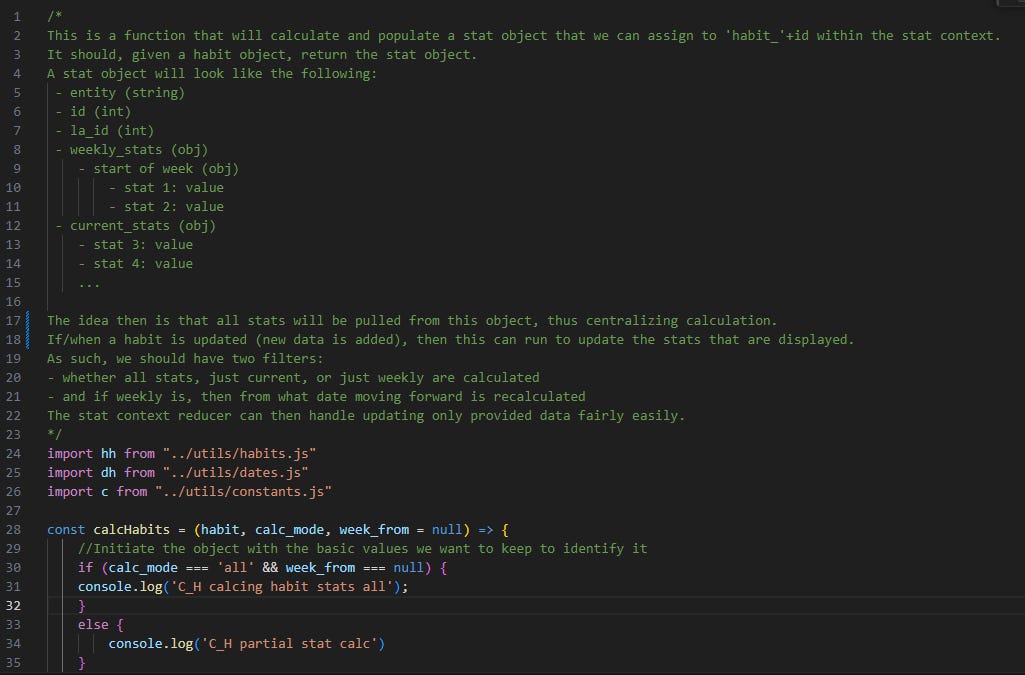
Long story short: we started the calcHabits function with the idea that it would default to calculating everything, but have the parameters necessary to only calcuate part of the data, or start recalculating from a specific date. That way, if the user updated a habit value for last week, we’d only have to recalculate last week and this week, not everything that happened before.
The next key came, with a little help from ChatGPT, in figuring out how to ensure that once a user updates a habit, we have a chance to update our state.habits and then run only the habit recalculation that needs to be updated. We did this by incorporating a trigger that is fired from our function that runs anytime a habit has a value added or updated. That trigger is then caught by a useEffect hook within our custom UseHabits hook.
For anyone who hasn’t used React, that probably sounds like gobbledygook, so let’s simplify:
Modern web apps tend to run things asynchronously, so in order to ensure that we update the habit value first and then update the resulting statistics, we have to setup a trigger mechanism.
Basically, one part of our software raises a flag that says “hey, this habit was updated on this date”…
And then another part of our software is constantly watching that and says “ah, that means I need to update the stats for this habit starting at that date.”
Simple in concept, complex to figure out in practice.
But once we got all that working, we had to take care of a variety of bugs in the new calc code, remove as much of the old calc code as we could, and clean up many inconsistencies in how our app was handling this data. That ~500 line habit utility file was cut down to ~180 lines. More importantly, the number of times it was referenced was reduced by ~80% (most of it now just deals with how to format things given the statistics).
With almost all the calculations moved to our calcHabits function, we were free to build in new features! Critically, we went from:
Past version: I’m not sure where I should put this new calc code and I’m not sure how many places I’ll need to reference it.
Now: I know exactly where to put this new calc code, and I almost certainly only need to reference it once!
There will be even more to come, but let me go through some of the new features that became almost trivial to add as we were doing this:
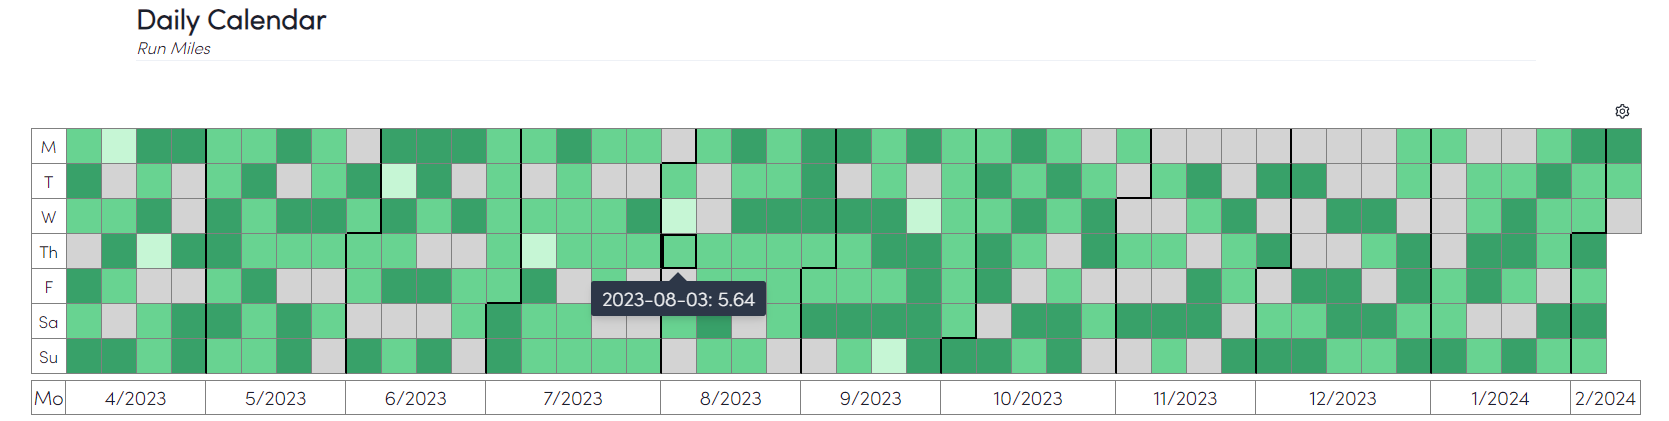
The Habit Heat Map
This is a personal favorite of mine - similar to Github’s commit tracking, it is a very visual way to see your long-term performance and notice any trends by day.
The Habit Index
A neutral measure of how well you are doing on your habit: normalized to 100 which will open up a lot of options for combining habits and giving broader performance measures.
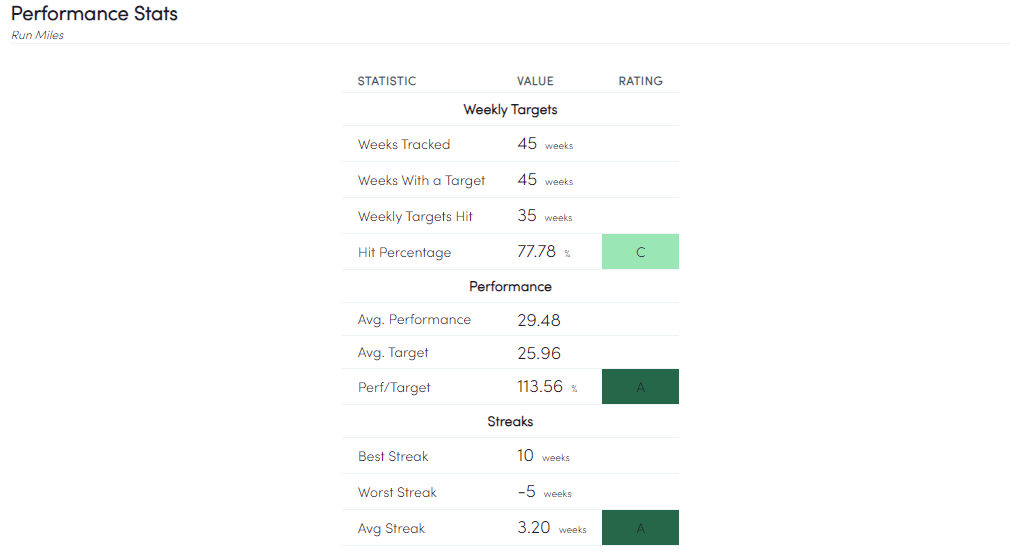
Performance Table
Nothing too fancy, but these aggregate stats would have been a mess to show in the past. Now, it’s just fetching the data from the state!
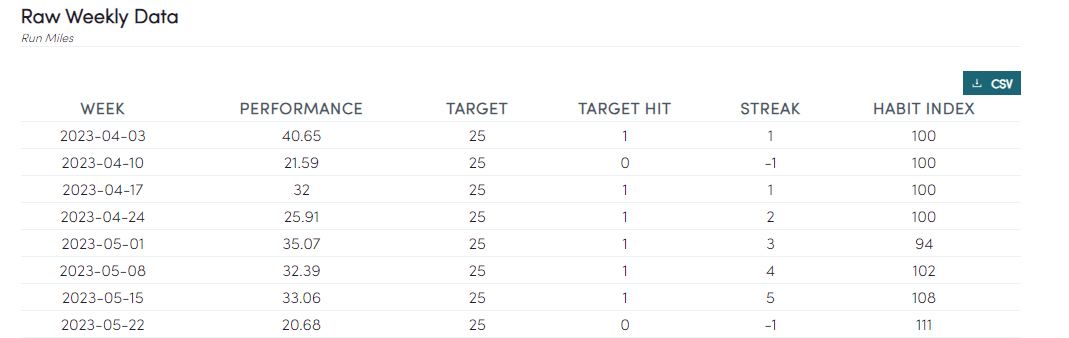
Raw Weekly Data, with CSV extract
Similarly, we can now quickly make all this data available to the user for their own analysis if our charts don’t cut it for you!
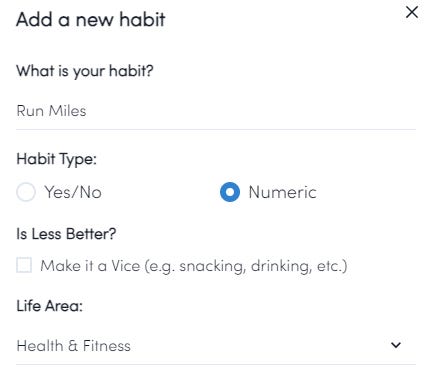
Support for Vices
E.g. a habit you want to do less of: now we reverse the shading, adjust the habit index and other stats accordingly
Better aggregate stats

In the past, our stats to aggregate each habit were quite limited: only using the past two weeks and not updating if you visited previous weeks. Now? They are enhanced and accurate!
And we’ll close with this: the performance of the app improved dramatically! I didn’t do any formal measure, but anecdotally:
The app appears on page quicker now (thanks to some other adjustments) but the data may take a slight bit longer to all show on screen, but…
The overall snappiness and speed of page transitions and any update is substantially better: I’d estimate in the 80% range!
Conclusion
When talking about data-driven systems, this example is admittedly a small fry. But I wanted to write about this system because it shares all the same characteristics, is relatable, and is illustrative of the problems that many companies face, albeit at a larger scale.
These kinds of transformations can work at a larger scale. Though rarer with bigger systems, these kinds of transformations do happen time and time again. It’s easy to get locked into the MBA-mindset of linear incrementality, but the reality of innovation is that taking a step back is very often the only way to take several big steps forward. Modernizing your data is one such case: the incrementality mindset will get you stuck at a local maxima, when much greater peaks exist.